|
QuickView Weather Information/Online Help Version 1.0.1 - August 23, 2009 |
| QuickView Weather: System Requirements |
Windows XP or higher .NET Framework 3.5 256MB RAM 10MB Hard Disk Space (this will exapand if multiple sites are configured) Download Demo for a 14 day trial of QuickView Weather! |
| QuickView Weather: Installation |
To install QuickView Weather, all you need to do is unzip the application to a folder of your choice. Then create a shortcut to the application and that's it! To uninstall QuickView Weather, just delete the folder and any shortcuts that have been created. That's it! |
| QuickView Weather: How To Use/Tutorial |
Upon starting the program for the first time, the following message will appear...  Clicking on OK will launch the Configuration dialog as shown below... 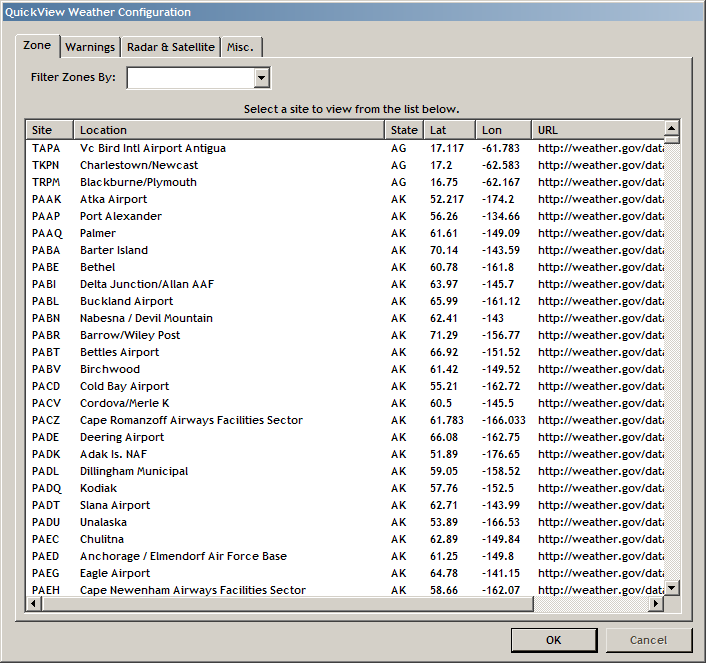 First up are the Zone settings. By default, there is no filter set and all locations will show. But, a filter can be set to narrow the selection options down and make it easier to find the desired station. This zone option is used to get the actual current conditions that are the heart of the application. Note that only sites supported through the National Weather Service are available. This is pretty much United States only (for now). So, select a Site by clicking on one in the list. Next, click on the Warnings tab. 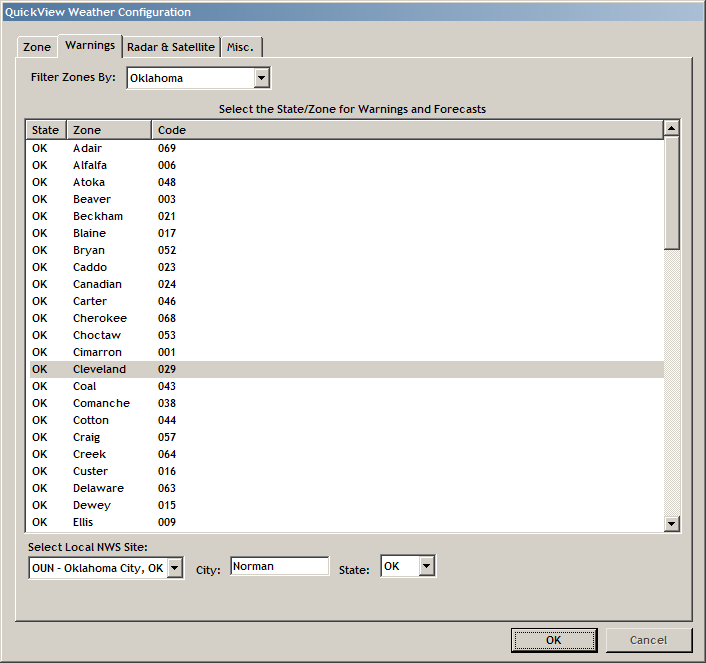 This works the same way as the Zone options did. It has multiple warning zones to choose from and they can be filtered by state. The Zone on this tab will be used to get Alert/Warning information as well as work with the 3 settings under the list to get the local forecast for the selected area. Speaking of those 3 settings... * Local NWS Site: Used to generate the URL necessary to download the forecast * City: Used to get the forecast for the specific city * State: Used with the City for the forecast Once these options are set up as desired, click on the Radar & Satellite tab... 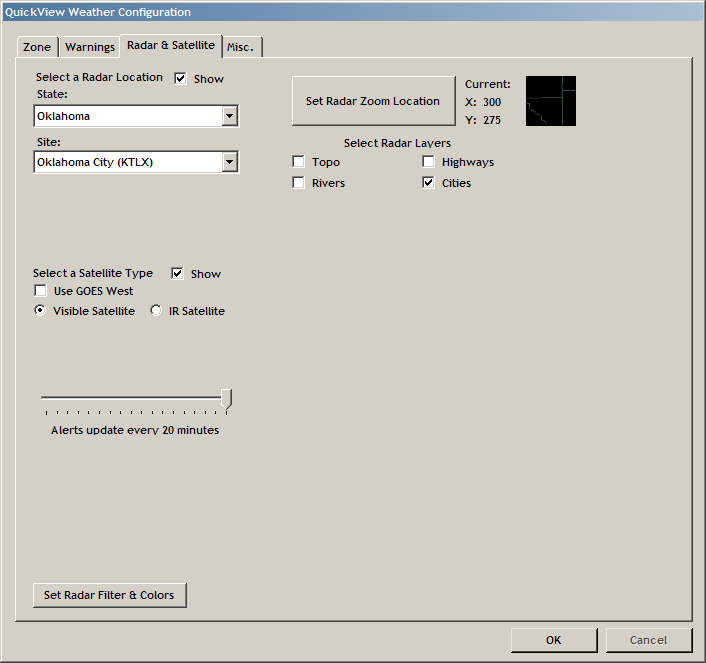 Options for this tab are as follows... * Radar Show Check Box: If checked, the selected radar will be downloaded and updated - if unchecked, it turns off the radar features * Radar State: Filters the radar sites for easier selection - this must be selected to choose a site! * Radar Site: Select a radar site to monitor * Satellite Show Check Box: If checked, the satellite imagery will be downloaded/updated and shown, if unchecked, the satellite features are turned off. Note that the satellite area is not user defined. It is centered on the lat/lon of the selected Zone tab site * Use GOES West Check Box: If this is checked, the satellite downloaded will be from GOES West - otherwise GOES East imagery is used * Visible Satellite Radio: If checked, the downloaded image will be the visible image * IR Satellite Radio: If checked, the downloaded image will be the infrared image * Alert Update Slider: Move the slider to the left or right to adjust the update time for the Alerts. Default is 20 minutes and the full range goes from 3-20 minutes. * Set Radar Filter & Colors: Allows the user to set custom color tables and filters on the radar image - see the main Color Table section for more information. * Set Radar Zoom Location: Allows the user to select a small area of the radar image to show in areas such as the new conditions update screen, as well as the "balloon" window and the Tool Tip window. See the Zoom Radar section for more information * Topo Check Box: Displays the NWS Ridge Topo base image on the radar (if unchecked, the selected background color will show) * Highawys Check Box: Will display the NWS Ridge Highways layer on the radar image * Rivers Check Box: Will display the NWS Ridge Rivers layer on the radar image * Cities Check Box: Will display the NWS Ridge Cities layer on the radar image Once those settings are set as desired, click on the Misc. Tab... 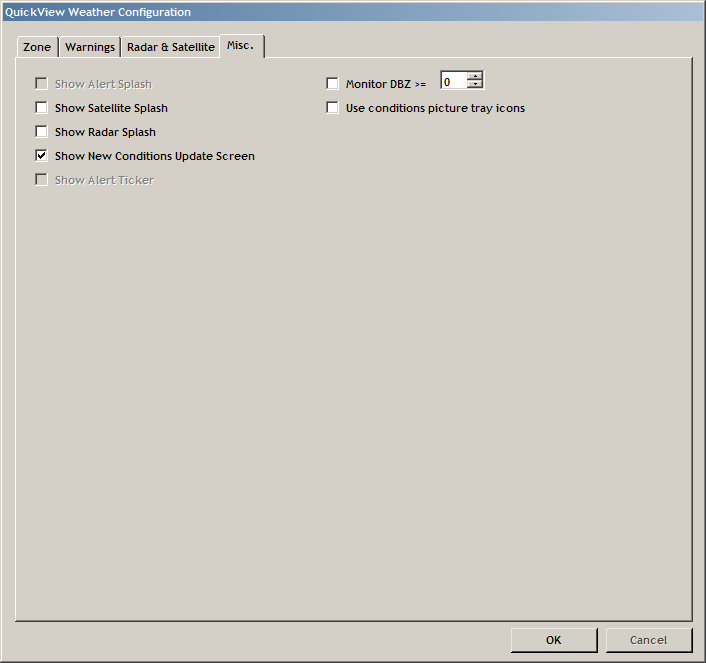 These settings are as follows... * Show Alert Splash Check: A feature that is to come - will display a "new current conditions" splash screen for alerts * Show Satellite Splash Check: If checked, each time the satellite image refreshes (15 minutes), a splash window appears showing a smaller version of the satellite image * Show Radar Splash Check: If checked, each time the radar image refreshed (7 minutes) a splash screen window appears showing a smaller version of the radar image * Show New Conditions Update Screen: If checked, each time a new conditions update comes in, a splash window appears giving a summary of the current conditions * Show Alert Ticker: A feature that is to come - displays a message for a user defined duration when a specific priority type of alert is encountered * Monitor DBZ Check: If checked, the Splash Radar location area will be scanned for a DBZ value that is greater than or equal to the defined value. If a DBZ value is detected, a window appears alerting the user of the situation * Use conditions picture tray icons: If checked, instead of seeing the temperature in the tray icon, the current conditions image will appear If all of the settings are now as desired, click on OK. If all of the required settings have been filled in, the configuration file will be written and the program will continue to load. If not... 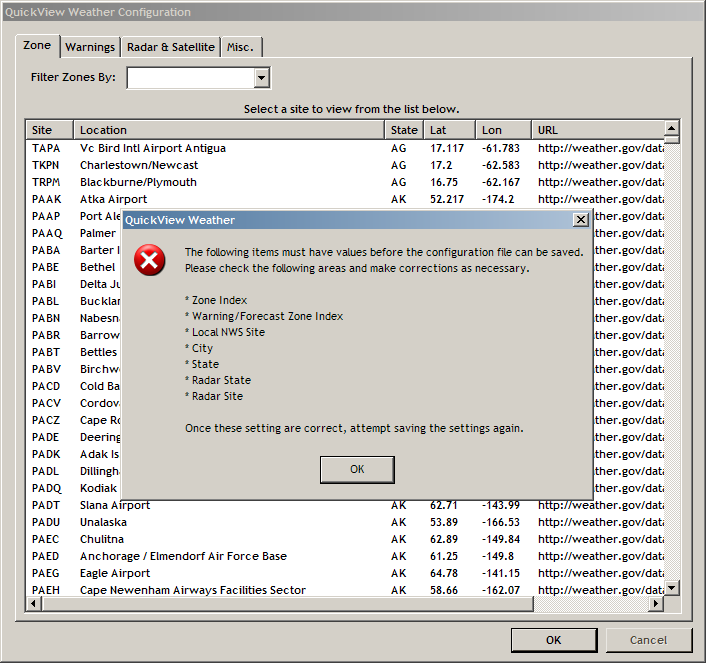 This dialog will appear. Those 7 fields MUST be filled out to continue. Once all required data has been filled in and saved, the initial loading data window will appear... 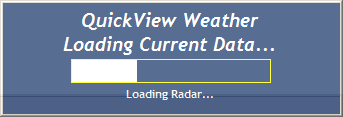 Progress is displayed for each step that is enabled. The only time this window appears is during initial program load and after a configuration update. Congratulations! The program is now configured and running (the icon should now show in the tray) So, what about the rest of the program. What can it all do? Main Window... 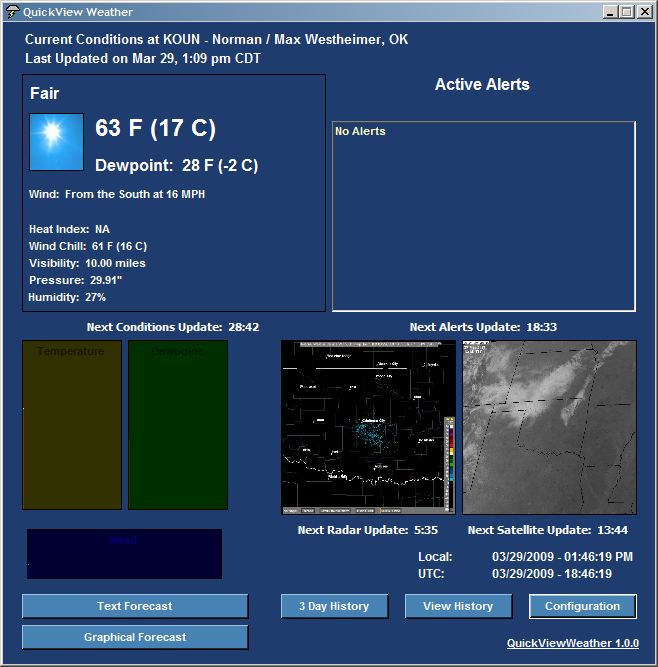 Access to all the program options are available through this main window. The window is basically divided in to 5 areas. * Current Conditions section (upper left corner) * Active Alerts section (upper right corner) * "Live" data graphs section (lower left - below Current Conditions) * Radar/Satellite/Time section (lower right - below Active Alerts) * QuickView Weather Options section (bottom) Text Forecast... 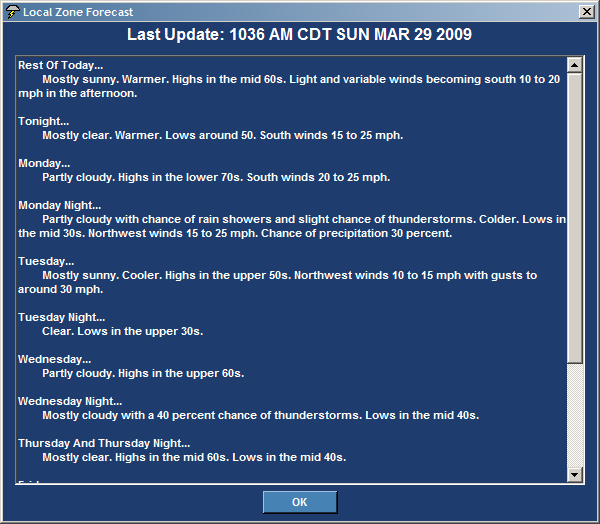 Clicking on the Text Forecast button on the main window or on the icon menu will show the above window. It has the latest forecast available and it's last update time Graphical Forecast "Graphi-cast"...  Clicking on the Graphical Forecast button on the main window or on the icon menu will show the forecast in the graphical picture format, as shown above 3 Day History... 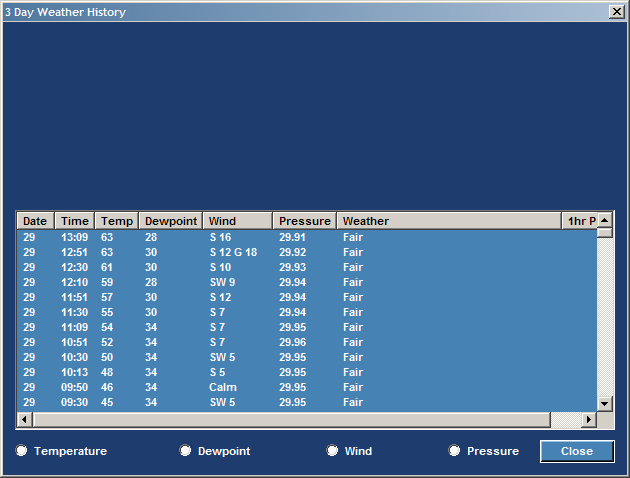 Clicking on the 3 Day History button or menu item will load the above window. Doesn't look too impressive at first glance, but selecting one of the radio buttons will change the display like the following... Temperature... 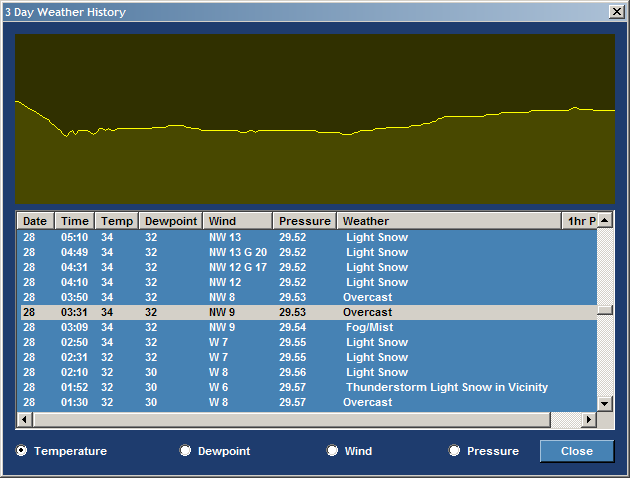 Dewpoint... 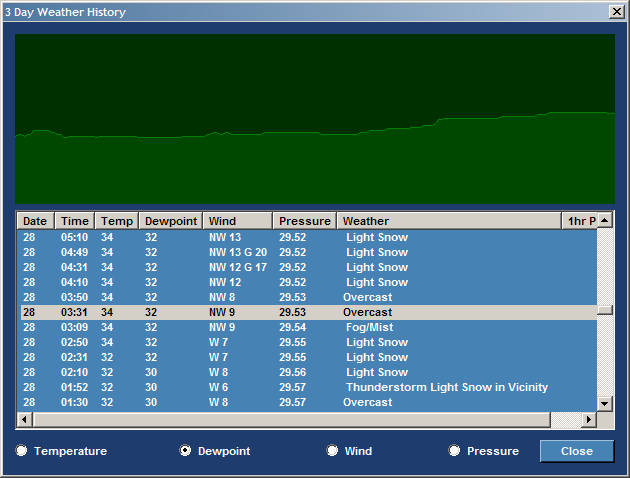 Wind... 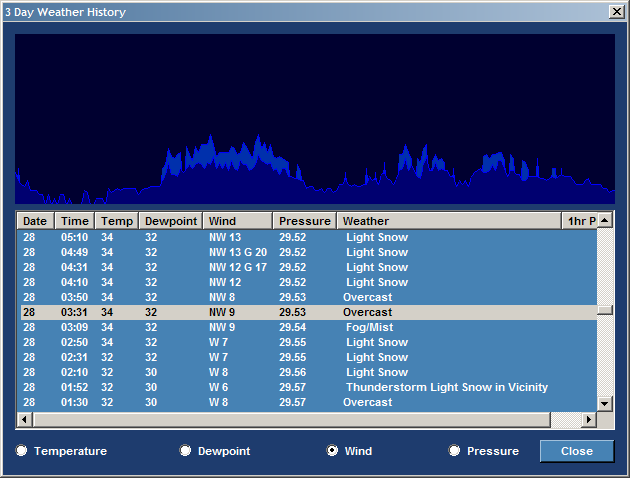 Pressure... 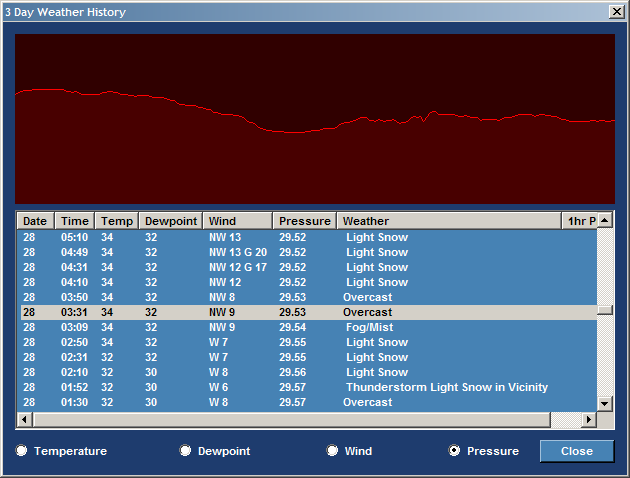 Also, moving the mouse over the graph will display the "selected" graph point in the list of reports. History... 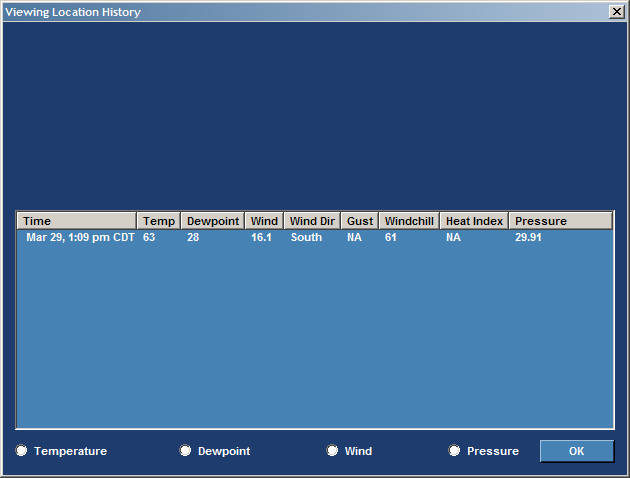 This works very similar to the 3 Day history form - it just graphs differently. 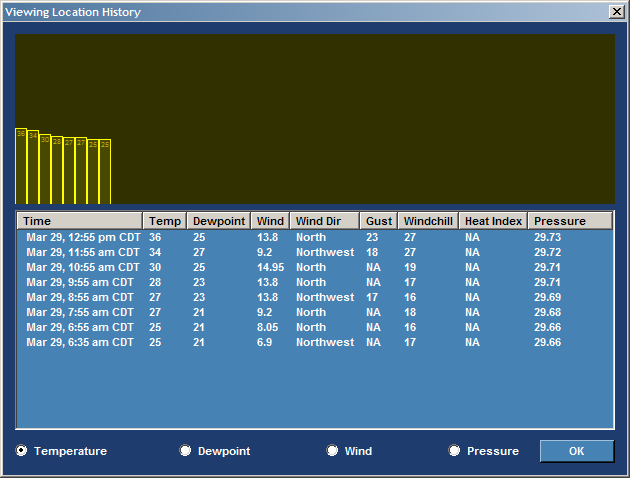 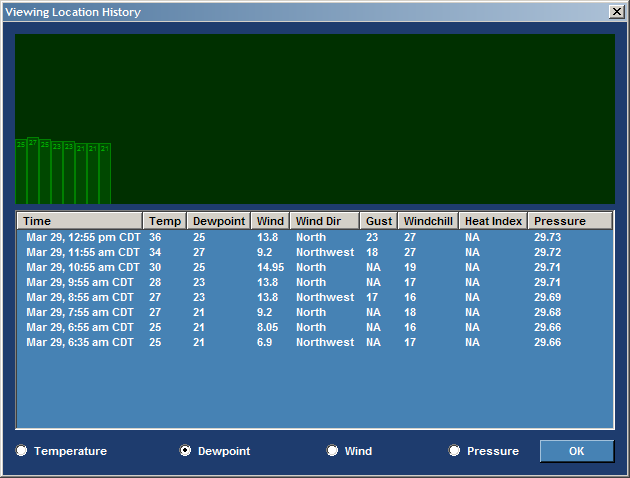 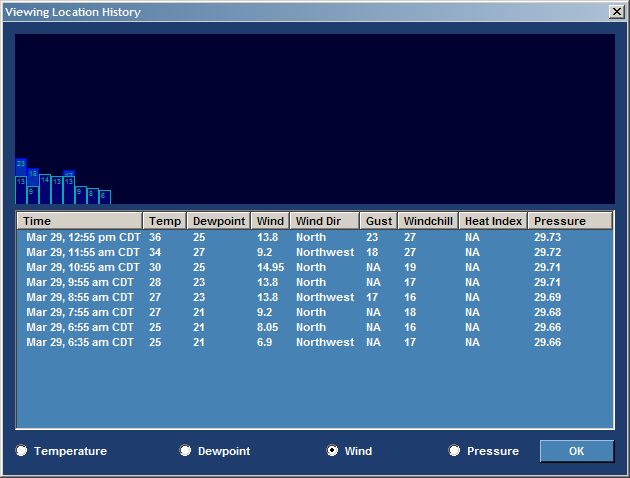 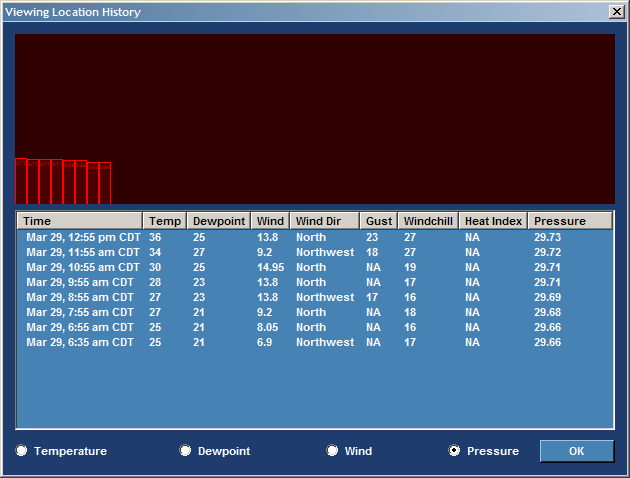 It should be noted here that mouse moving over the graph has no effect here. Also, the lighter blue areas on the Wind graphs indicates gusts. Color Table Editing/Filtering... 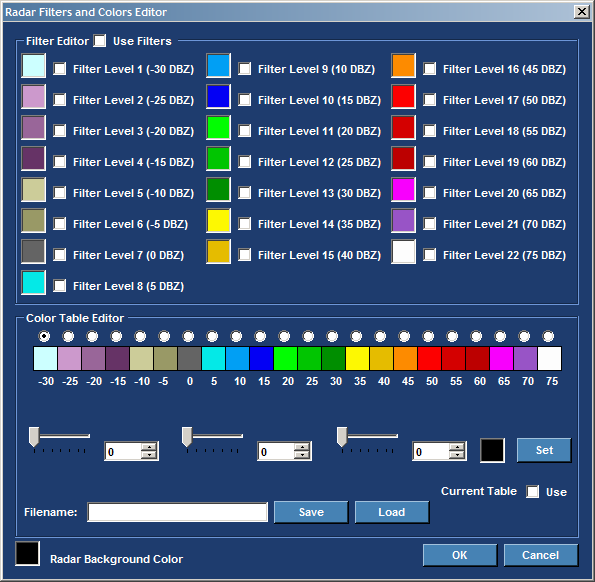 There are 3 sections for this editor (yes, it's a very busy window) * Filter Editor * Color Table Editor * Default Radar Background Color Checking the Use Filters check box will enable the user to filter out any of the checked colors on the radar image. If unchecked, no filters are used - even if specific colors are checked The color table editor is set up so that a user can change the look of the radar image by making the reflectivity use a custom coloring scheme. To edit a color, select the radio button above the color box. Then, use the three sliders to change the color to the desired value (the spin edit boxes may also be used to directly enter an RGB value) - then, once the desired color is found, click on Set to update the color box for the selected DBZ value. Once all of the colors have been edited, enter a filename in the box (do NOT enter an extension, QuickView Weather automatically does this) and click on save. If the table is then desired to be used, check the Use check box to apply the table. Note that this only takes effect if the Configuration window's OK button is clicked! If Cancel is clicked, ALL table changes are discarded (the table itself will still be changed, just not active). Finally, if the Topo layer is not being used, the background color for the radar can be changed by clicking in the color box next to the label and selecting a new color. Remember that the image layers themselves are not able to be directly edited, so if the Highway, City, River, etc. layers do not work well with the background color selected, they must be manually edited through a paint program, or the background color must be adjusted to work. Splash Radar Location Configuration... 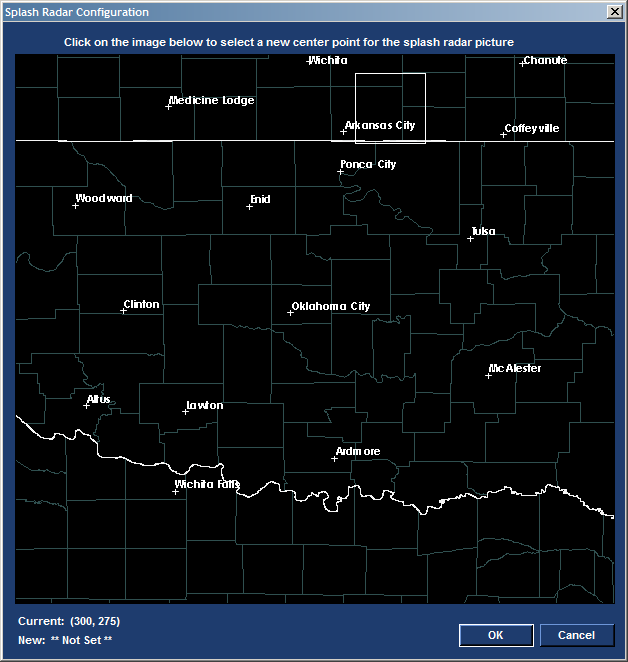 Move the mouse so that the white box is over the desired area and then do a single left mouse click to set the new location. Note that the white box currently continues to follow the mouse, so make sure to check the New: label to see if the location has been set. This is the area the splash radar images will show. Tray Icon... This is the look/style of the Tray Icon. There are a number of states/color combos that indicate different things... * Blue gradient background: Normal * Blue gradient background with Yellow line: Normal - also displays temp trend since last update * Yellow gradient background: Normal - Report is over 90 minutes old * Red gradient background with red outline: An alert is active for the selected location * Red gradient background with red outline and Yellow line: An alert is active and the temp trend is displaying * Orange gradient background with red outline: An alert is active and the last conditions report is over 90 minutes old Also, right clicking on the tray icon displays the following menu... Large Radar/Satellite Windows... Double clicking on the mini radar and satellite pictures on the Main Window will enlarge them to their original size. Double clicking on the enlarged windows will close the big pictures Radar... 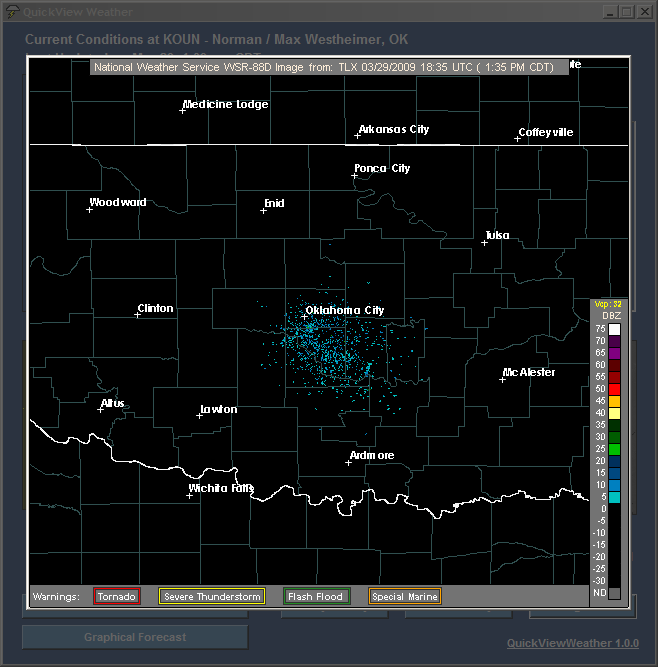 Satellite... 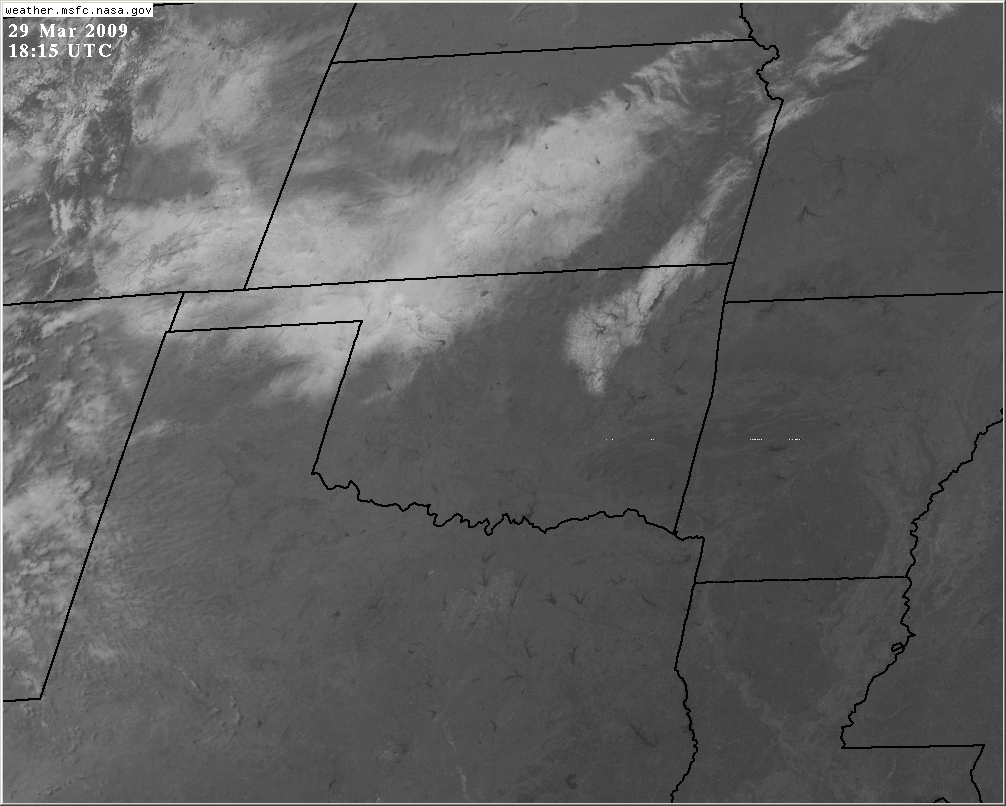 Hovering the mouse over the Tray Icon displays the Tool Tip window... 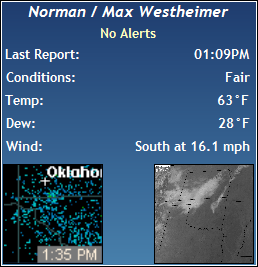 This window displays a quick summary to the user of the conditions, as well as the top priority alert, radar and satellite New Conditions Update Splash...  This is the window that will show (if the option is turned on, that is) each time a new update, as defined by the last condition update time in comparison. It's main purpose is to be a non-annoying way to alert the user of the newest update, as well as giving status of the radar, satellite and top priority active alert. |
| QuickView Weather: Purchase |
| Sound like a good deal? QuickView Weather is affordable, very useful and only costs $15! Head over to the Purchase page and get your copy today! |